|
Sometimes, I get to meet clients in cushy offices while sitting in comfortable chairs. More often than not, I meet clients on their shop floor where all the action happens. However, last Wednesday I had the unique opportunity to meet a client in his own garage while he worked on repairing a car.
I''d known Geoff ever since he came over from England a few years back, but just a few weeks ago he called and set an appointment for some one-on-one training. When I arrived at his office they told me that he''d gone home early to take care of something, but had left word to ask if I wouldn''t mind meeting at his house. As that wasn''t a problem, I soon found myself pulling into his driveway. The garage door was open and I saw him bent over beneath the hood of an older station wagon. He was banging on some part of the engine with a wrench.
"Hey Geoff... need a hammer?" I asked as I walked up.
"How''s that again?" he replied in his crisp English accent.
"I asked if you needed a hammer instead of that wrench you''re using to bang on whatever it is you''re banging on."
"Oh... yes, actually. There should be one over on the table there, if you don''t mind," he said, pointing to the far side of the garage. "I happened to have this spanner in hand and thought it might work, but this has proven to be more stubborn than I''d guessed."
"Here you go," I said, handing him the hammer.
One or two blows later, the part slid firmly into place and he stood up. "Thank you. Turns out using the right tool for the job makes a difference." He chuckled as he wiped his hands on a rag and motioned to a couple of folding chairs set up on the side of the garage. Next to the chairs was a bucket with ice and frosty bottles in it. Geoff grabbed two and handed one to me. "I''m eager to get out from under the bonnet for a bit anyway."
"Well, cheers, but... under the what?" I asked.
"The bonnet," he replied, then noted my puzzled expression. "Sorry... you''re a Yank. You''d call it the hood, I suppose."
"Oh, right. Bonnet, hood... I got it. So is this station wagon the reason you left your office early?" I asked.
Geoff chuckled. "There''s another one: You call it a station wagon. I''d call it an estate car, and yes. I promised my niece that I''d work on her car for her. She''s turning 16 in a week, you know. First car... and growing up around my grandfather''s shop in Cookham, I learned a thing or two."
"Nice. I suppose that''s a skill that''s always handy to have." I said.
"It is, but it doesn''t help me understand any of this Quality Improvement stuff my company wants to start. They''re bringing in a trainer from corporate next week. I don''t know the first thing about it, but I don''t want to look dense. That''s why I called you. I thought you might help give me a little introduction to the subject; a little head start."
"What sort of introduction do you need? I''m happy to try to help." I offered.
"For instance..." he began. "I don''t understand why there''s so many different kinds of tests, and so many different kinds of charts. I mean, a chart''s a chart, right? I see some times you''ll use bar charts and some times you''ll use line charts... it doesn''t really matter, does it?"
"Well... let me answer your question with another question: How long do you think that last bit of engine work you were doing would have taken if you''d continued using the ''spanner'' and not switched to the hammer?" I pressed on. "Once you had the right tool for the job, the job went a lot more smoothly, right? Charts work the same way. Charts ARE tools, and the right tool can make all the difference."
Geoff nodded. "Aha! Got it. But which charts do you use when?" He reached over and grabbed a nearby legal pad and a pen to take notes.
"Now that''s an excellent question. I can explain a lot about that so you''ll understand... and then when I''m done, I''ll explain why you don''t need to take notes and don''t need to remember any of this," I finished, pointing at his pen and paper.
Again, he looked puzzled. "What''ya mean by that? Why won''t I need to remember it?"
"We''ll get to that when we get to it. Right now let''s start on the first lesson: variable data vs. attribute data," I motioned to the bucket of icy beverages. Tell me exactly how many bottles of beer are in this bucket."

Geoff looked down at the bucket for a moment. "Nine."
"Great," I continued. "Exactly how many ounces of beer are in this bucket?"
He looked up and to the left for a moment while he did the calculations in his head. "One hundred and eight ounces... more or less."
"Very good. Why did you say ''more or less?''" I pressed.
"Because if we''re really talking exact ounces of beer, there might actually be a little more or a little less than twelve ounces in each bottle," he answered.
"Perfect. You''ve just demonstrated the difference between attribute data and variable data. Attribute data is counted. It''s all integers. You''re counting things: Number of defective parts made, number of dings on a car door, things like that." Geoff nodded.
"Variable data is measured, so you''ll probably have decimals. You didn''t actually measure the ounces of beer in the bucket, but your estimate took that into consideration. If you did measure all the beer, you''d probably find that it''s 109.21 ounces or something like that, right?" Geoff nodded again.
"Some charts are used only with one type of data or the other, and some charts you can use either type of data." I saw Geoff pick up his paper and pen. "You don''t need to know which charts are which right now. I''ll get into that at the end."
Geoff put down the notepad and I continued. "The two types of charts you''ll use most often are line charts and bar charts. Let''s just concentrate on line charts today to keep it simple."
"Okay," agreed Geoff.
I opened my laptop and found some sample data, and used QI Macros to create a chart as I spoke.
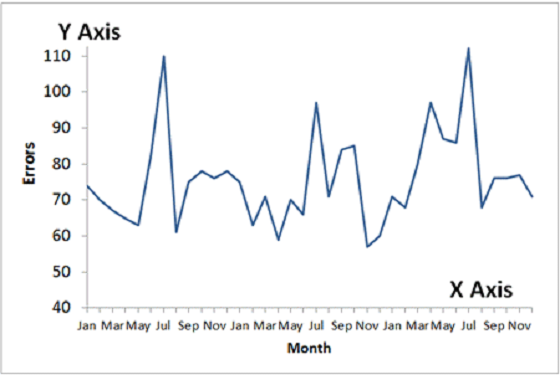
"Sometimes, you''ll keep track of things that happened over time. For instance, you''ll keep track of the number of parts your factory produced each day of the month, or maybe the amount of bad parts you produced each month. You''ll want to compare each period''s total with the next period''s total, and see how it''s fluctuating over time, right?"
"Sure," remarked Geoff.
"That''s where you''d use some form of line chart." I turned the screen around and showed him the line chart I''d made.
"Couldn''t you show that in a bar graph as well?" asked Geoff.
"If you graphed this as a bar chart, it would show the same thing, but it wouldn''t be as easy to tell the differences between months as it is when you use a simple line chart. Our eyes can see bends in a line more easily than comparing heights of boxes," I explained.
"Aha! That makes sense. So this is the chart I''d use, then?" Geoff asked.
"Not exactly," I countered. "It might help to also see the average of all the points on this chart. That way, we could tell if a certain period were over or under the average, right?"
"Sure."
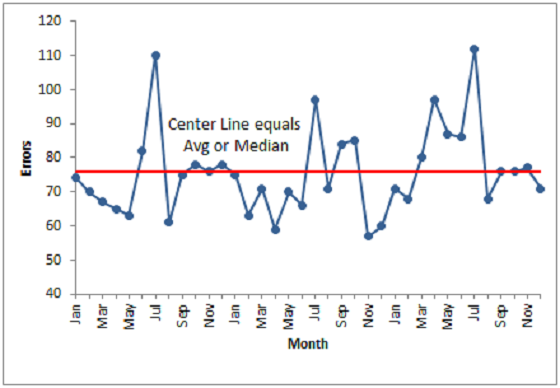
I tapped some more keys on my laptop. "This is called a Run Chart. It shows the same things a line chart does, but also adds a Center Line for the average or the median."
Geoff''s eyes widened. "That is helpful. So a Run Chart is the chart to use, then?"
"Not quite," I explained. "This is where statistics comes in. See, the Run Chart tells us what happened in your process, but if we use statistics to analyze this process we can tell a lot more about what''s happening. We can predict, based on what''s happened in the past, where most of the points in the future are likely to occur. Statistics can also show if a pattern is really unlikely or unstable... here, take a look at this."
"Woah... this looks bolloxed," said Geoff.
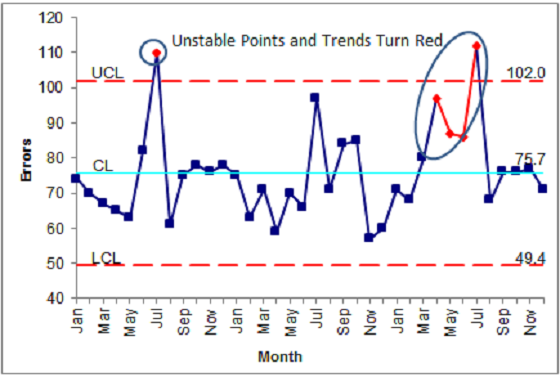
I chuckled. "This is called a Control Chart, and it''s pretty easy once you get into it. Let''s take it one bit at a time. See those red dashed lines?"
"Sure," he responded.
"Those are the Control Limits: The Upper Control Limit and the Lower Control Limit. The software I use calculates those automatically. If your process is stable to begin with and continues to be stable, you should see the vast majority of your points between those lines. See that point from that first July that turned red?" I circled it on the screen.
"Yeah. That''s outside the UCL. Is that why it''s red?" he asked.
"Yep. The software is alerting us that something unusual might be happening there."
"But what about those other points that turned red? Most of those are inside the Control Limits." Geoff asked. A car pulled up and parked on the street in front of the house.
"That''s a great question," I began, pointing at the car that just pulled up. "Is that your wife''s Cadillac?"
"Yes. She loves it. Just picked it up six months ago," he remarked, as he waved a greeting at the woman getting out of the car.
"Does it have that safety feature that warns you if the car is starting to drift out of your lane?"
"Sure does. It''s got every option and amenity," Geoff remarked. "Not like the old primitive Triumph TR7s I grew up with, I can tell you."
"Well, the points on this Control Chart turned red because it looks like the process was about to drift out of its lane there. Too many points that are too close to the Control Limits set off a warning that something might be out of whack, just like the alarm on her Cadillac" I explained. "The process is becoming unstable, so the QI Macros software warns you."
"I see now... I''ve got it. So are THESE the kind of charts that we''ll be using?" he asked.
"Yes, most often Control Charts are the charts that you''ll be using to track this sort of thing. You''ll track your processes and see if they''re staying in control, and you''ll track any improvements and see if the chart tells you that you''ve made a difference." I explained.
"Right, then. So now, tell me why I haven''t been writing any of this down?" he asked.
"First, tell me about those old cars you mentioned. You said you had Triumph TR7s?"
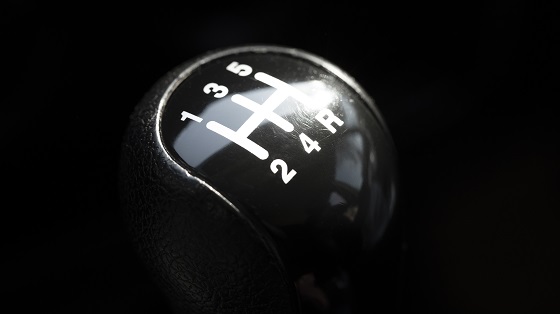
"I did, all from the 70s. I thought they looked so hip back in the day. Had a lemon yellow one first, then an orange one, then a green one. Spent more bloody time fixing them than driving them. All of them had a manual transmission. You know: a stick shift," Geoff reminisced.
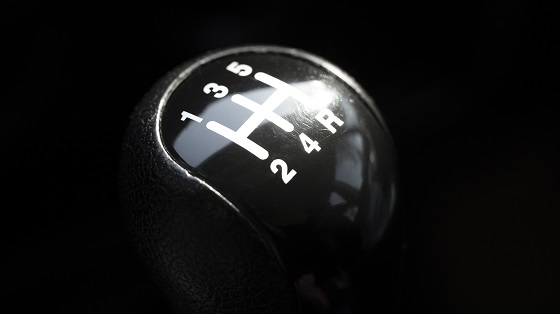
I pointed at the station wagon he''d been working on. "What about that car? You said it''s for your niece? Has it got a stick shift or an automatic transmission?" I inquired.
"Oh, that''s an automatic," he replied. "Almost all the cars now are automatics."
"Your niece is taking Drivers'' Education classes, right? Do they teach students nowadays how to drive a stick shift?" I asked.
Geoff scoffed. "Are you kidding? There isn''t a need to anymore. It''s hard to even FIND a stick shift car nowadays, so they don''t teach that in the regular Drivers'' Ed. I think there''s another class you can take afterwards if you want to learn to drive a stick shift. It''s not really a useful skill anymore, unless you''re going to drive a sports car."
"Well, that''s why it''s not important to memorize which charts are used for which types of data, and memorize which formulas are used to calculate each chart." I explained.
Geoff looked puzzled. "Because of automatic transmissions?"
I nodded. "Exactly. Just like the technology of the automatic transmission made it unnecessary to teach the stick shift, software technology means you no longer have to memorize things like formulas or decision trees about what chart to use for which type of data. QI Macros does all that for you. You just highlight your data and it chooses the correct chart based on the type of data you have and the number of columns of that data," I explained.
"Really?" he asked, amazed.
"You bet. Don''t get me wrong: there are some people out there who insist that just because they memorized all those things when they were learning, everyone still needs to memorize them now. It''s simply not true." I asserted.
"Is that so, across the board then?" Geoff asked.
I chuckled. "I said that not EVERYONE needs to memorize that stuff. It''s true that some of the people who go on to specialize in Quality Improvement and Lean Six Sigma might need to know that stuff... they''re kind of like the sports car drivers who still need to know how to drive a stick shift. For the vast majority of drivers, that''s not the case. How about you, Geoff? You know how to drive a stick shift. Do you drive a sports car?" I asked.
"I drive a Toyota Camry," he laughed. "I love it, but that''s about as boring and as far away from a sports car as you can get."
"And when is the last time you did drive a stick shift?" I pressed.
"Oh, probably... more than 30 years ago, when I still had a TR7!"
"Quality Improvement is the same way. There''s lots of folks like you who are probably never going to be a Lean Six Sigma Master Black Belt, but if you use this software you can learn to track your processes and prevent them from sliding out of control, and even identify more improvement projects you can work on. Once you get into Quality Improvement, you might find out that you or one of your employees has a real knack for this stuff. At that point, you can choose to invest in some more training for that person and... send them to learn to drive a stick shift, as it were. But even for those high-end professionals, they find that QI Macros is a powerful and easy to use tool. It''s the automatic transmission for Quality Improvement that does what you need it to do for 95% of the people out there. It shrinks the learning curve on Quality Improvement just like the
automatic transmission shrunk the learning curve for Drivers'' Ed."
"But what if our trainer doesn''t use that QI Macros software?"
I smiled. "I happen to know the trainer your corporate office uses. She uses QI Macros when she trains Quality Improvement. You''ll do fine."
Geoff stood up. "Well, I suppose that''s the first lesson. I wouldn''t mind getting in another one or two before the trainer gets here."
I stood and placed my empty bottle in the recycling bin. "No problem. Give me a call tomorrow and we''ll set a time."
"Will do, mate," said Geoff, returning to his engine work under the ''bonnet.''
If you''re interested in learning more about which chart you should use, Jay himself can explain things much better than this narrative. Click HERE to view his video. Click HERE to see how easy it is to create Control Charts. If you believe that everyone still needs to learn formulas and decision trees in the 21st century, click
HERE and Jay can tell you in his own words why he believes they don''t need to.
|




 Arts and Entertainment
 Business and Industry
 Computer and Electronics
 Games
Games Health
 Internet and Telecom
 Shopping
 Sports
 Travel
 More
More