


The Washington Post's scrollystory on epidemics (Warning: Paywall ahead) explains how diseases spread in a group of people, and shows how to stop an epidemic - something we wished we all knew a month ago, when this story first came out. But it's still a great explanation of concepts like the basic reproductive number and the effective reproductive number. (JNY)


# Don''t Miss
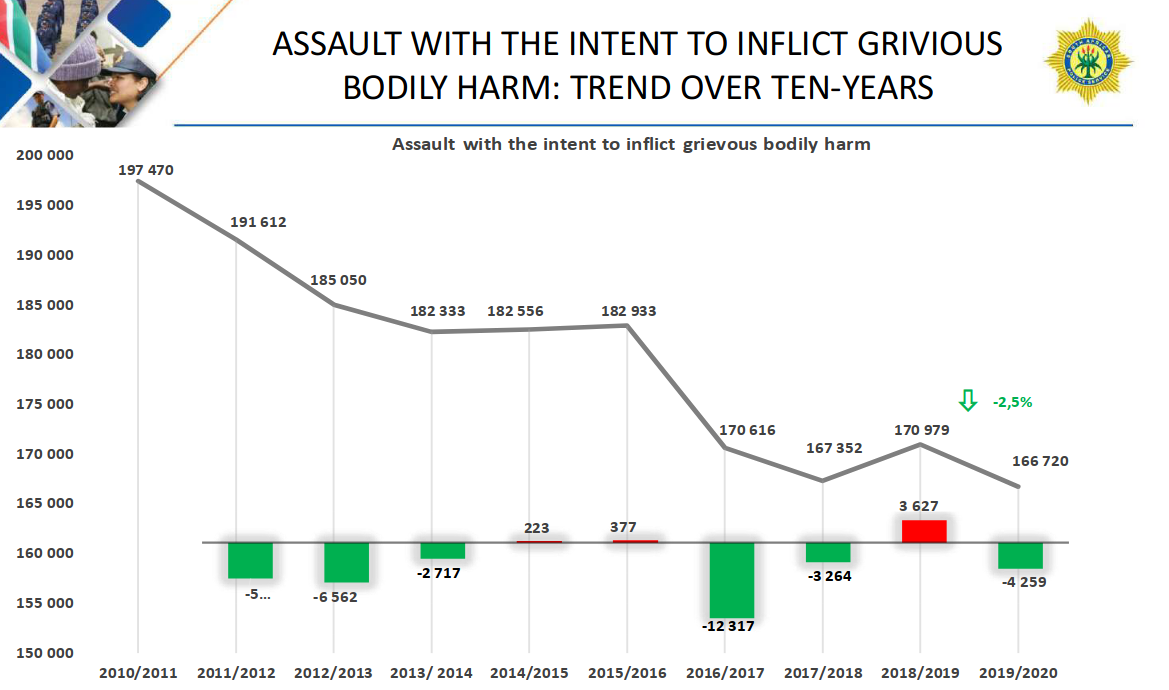
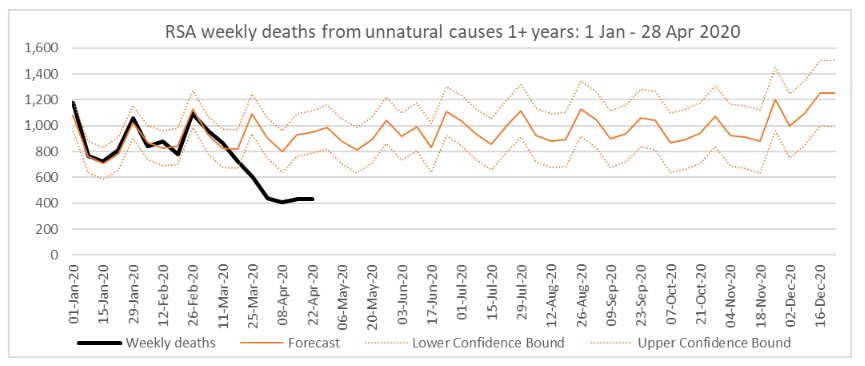
Here's what happened to South Africa's missing Covid-19 data
There's a potential problem emerging in South Africa's ability to the spread of Covid-19 around the country: poor quality data. Health minister Dr Zweli Mkhize took to Twitter to explain what's going on, in a Tweeted JPG (...) statement. According to the minister, once a case has been confirmed, patients are supposed to fill in a form with their personal details and the information of those that they may have come into close contact with - and despite carrying a penalty of up to 10 years jail time if not returned, by the sound of it these aren't coming back properly completed, and NICD is struggling to fill in the gaps. The kicker, and far more serious than the gaps in the data that are emerging, is that Mkhize signed off with a threat. Not just jail time, but if your forms don't come back correctly completed, you will be publicly named and shamed so anyone who knows you can get tested. Read all about it (AO)
Uganda's internet tax is crap
Well, we kind knew that, but it's always good to have the data to prove it. Pollicy launched a report this week assessing the effect of Uganda's tax on "over the top" (OTT) internet services (like Facebook, WhatsApp, Tinder, etc), which was introduced in 2018 and aimed to raise $129m a year for government coffers. What did the report find? Internet usage in the country dropped by a third, and actual revenue fell from around $1.5m a month to $1m, far short of projections. And 62.3% of businesses said their income had been affected. Read the full report here. (AO)
The only corona predictor you need
We've seen many projections about the potential spread of coronavirus in different countries around Africa over the last couple of weeks, some that look convincing, others that seem patently mad. I'm not going to link to any of them because I'm not qualified enough to know which side of the sanity line they are.
Gabriel Goh's Epidemic Calculator, however, is awesome. It's a bit initially overwhelming with all its sliders and variables, but all you really need to know is that it's preset with some general numbers that reflect current knowledge about Covid-19 (what percentage of the infected need hospitalisation, how many die, how long people are infectious for) which you can update as new information comes up. The key slider to play around with is the big one marked R0. This is the number of people one carrier infects on average, and what Goh's tool does is show that just reducing this number a tiny bit, from say, 2.3 to 2, can reduce the peak number of hospitalisations from 200 000 to just 12 000.
It is, obviously, an imperfect model (a low R0 depends on social distancing going on forever, and new data on mortality and hospitalisation rates is coming out every day). But it is a great showcase for how a little effort can make a big difference. (AO)
Every .za website MUST link to SA's Coronavirus site
Say what? According to legislation published in March 2020's Government Gazette, all websites ending with a .za in their domain name will need to carry a link on their front page to SA's official Coronavirus website.
No punishment is described for the websites that don't comply, and there is no indication how this would or could be checked and enforced. How many actual websites the 1.3 million domains represent is unclear, because some will be dormant, while others could have multiple websites. In addition to this shock-rule, Minister of Communications and Digital Technologies, Stella Ndabeni-Abrahams, ruled that cellphone users can't port their numbers; "licensed entities" cannot increase prices, and access to educational information must be zero-rated. Read all about it (JNY)
Data journalism in the time of cholera
Some of the most famous infographics - John Snow's Broad Street Pump (1854) and Florence Nightingale's rose diagram (1858) - have been born out of the need to save lives in times of disease. Neither of these however could be considered data journalism. Infographic historian Scott Klein has unearthed a fascinating chart published in The New York Daily Tribune, on 29 September, 1849, showing the rise and fall of cholera. What's amazing about it is that it would have been the first time most of the readers would have seen anything like it, so it needed a 300-word explanation.
He also notes how much work and money would have gone in to creating such a graph.
"Illustrations and line art had to be carved by hand into small wooden blocks. Bigger illustrations were made by bolting several blocks together (if you look at the cholera chart closely, you can see some of the seams between the blocks). The process was laborious and hard to pull off on the daily deadline of a newspaper. It took great skill and there were only a handful of craftsmen who could do the work. Few if any newspapers had on-staff engravers, so it's likely the Tribune would have had to bring in somebody with rare skills who could command a high fee." (He makes it sound as bad as trying to put a custom D3.js graph into a CMS.) (JNY)
Covid-19: The podcast
Excuse the slightly misleading headline. There is a Covid-19 podcast, but tbh I'd rather actually catch Covid-19. This podcast, however, is actually about how journalists are going about covering the Coronavirus, as opposed to the disease itself, which is, imho, MUCH more interesting. Find out about it here, or just listen on Spotify or Apple Podcasts. (JNY)
# Book Learnin''
Learn D3 today (well, probably not all of it today)
If you've suddenly got time on your hands, you're looking to learn something new, and if you're honest with yourself you're not actually going to start yoga, then check out Mike "The Legend" Bostock's intro to the graphing library that rules the interwebs, D3.js, at observablehq.com/@d3/learn-d3.
Bostock uses the Observables environment (which he also created) to both teach you D3 and let you experiment live with the data, and the platform. This course will definitely get the basics under your belt, and give you enough D3 knowledge to be dangerous. (JNY)
John Hopkins teaches epidemiology for all
As we are repeatedly at pans to point out, we're not epidemiologists here at Naked Data, but we could be. With time to fill in self- or enforced-isolation over the next three weeks, it makes sense to sign up for this free course offered by coronadata-meisters at John Hopkins University. It's called Fighting Covid-19 with epidemiology, and it promises to get you up to speed with:
"...a basic understanding of these essential tools, [and] this Teach-Out provides a way for you to learn and connect with one another while continuing to practice the social distancing measures that will help keep us safe. We also hope to provide you with some tangible calls to action that will help you affect positive change for yourself, your community, and our society." (AO)
# Finally
The world while social distancing
Thank you, Terrible Maps (AO)


 Arts and Entertainment
 Business and Industry
 Computer and Electronics
 Games
Games Health
 Internet and Telecom
 Shopping
 Sports
 Travel
 More
More
Journalist, developer, community builder, newsletter creator and international man of mystery, Jason was one of the first South Africans to really grasp the importance of data in the newsroom and has remained one step ahead of the trends in the field all the way. Even Naked Data was conceived before email newsletters were cool again. But what does that tell you about the measure of the man? Nothing, that''s what. He hides the superman CV behind a truly mild-mannered and overly modest persona and is best described as "one of the nicest guys in the business". When he''s angry, it is righteously so, and his anger always wears velvet mittens. The true signs of his genius include the ability to create multilingual puns on demand (witness the alternative Naked Data strap "Putting the heita in to data") and the fact that he offered me a job. (AO)